从业余的 Python 爱好者到专业的后端开发者,加上在公司实习的几个月,过去一年学到不少东西,但不论使用什么语言,一个 Web 应用后端要完成的工作抽象出来就是:接收和解析请求——>处理业务逻辑——>产生和返回响应,而围绕这个核心创造出的优秀服务组件与工具也层出不群,这里我将自己接触和使用过的做一个快速梳理。
✉️
免费订阅更新
订阅我的免费通讯,第一时间获取生成式 AI 领域优质内容
我承诺保护您的隐私,不会向第三方分享您的信息。
概览
数据库 首先需要一个数据库用于持久化数据,传统的关系型数据库,PostgreSQL、MySQL 等具有很高的稳定性和不俗的性能,结构化查询,支持事务,由ACID来保持数据的完整性。
MongoDB 快速安装Install MongoDB Community Edition on Ubuntu
1
2
3
4
5
6
7
8
9
10
11
12
13
14
15
16
17
18
19
20
21
22
23
24
25
26
27
28
29
30
31
32
33
from flask import Flaskfrom time import timeimport pymongoapp = Flask(__name__) mongo = pymongo.MongoClient('127.0.0.1' , 27017 ) db = mongo.todo class Todo (object ): @classmethod def create_doc (cls, content ): return { 'content' : content, 'created_at' : time(), 'is_finished' : False , 'finished_at' : None } @app.route('/todo' def index (): start = request.args.get('start' , '' ) start = int (start) if start.isdigit() else 0 todos = db.todos.find().sort([('created_at' , -1 )]).limit(10 ).skip(start) return dumps(todos) @app.route('/todo' , methods=['POST' ] def add (): content = request.form.get('content' , None ) if not content: abort(400 ) db.todos.insert(Todo.create_doc(content)) return Response()
HTTP 压测 安装wrk
1
2
3
4
5
6
sudo apt-get install build-essential libssl-dev git -y git clone https://github.com/wg/wrk.git wrk cd wrk sudo make # move the executable to somewhere in your PATH, ex: sudo cp wrk /usr/local/bin
结果分析
1
2
3
4
5
6
7
8
9
10
11
12
13
14
15
16
17
18
19
# 启用12个线程,每个线程并发100个连接,压测5秒 $ wrk -t12 -c100 -d5s -T1s --latency http://127.0.0.1:8000/todo Running 5s test @ http://127.0.0.1:8000/todo(压测时间5s) 12 threads and 100 connections(共12个测试线程,100个连接) Thread Stats Avg Stdev Max +/- Stdev (平均值) (标准差) (最大值)(正负一个标准差所占比例) Latency 708.00ms 391.49ms 1.98s 69.26% (延迟) Req/Sec 15.33 12.78 60.00 72.85% (每秒处理中的请求数) Latency Distribution 50% 307.50ms 75% 316.26ms 90% 322.70ms 99% 336.15ms 609 requests in 5.06s, 0.92MB read (5.06秒内共处理完成了609个请求,读取了0.92MB数据) Requests/sec: 120.25(平均每秒120.25个请求) Transfer/sec: 186.01KB(平均每秒读取数据186.01KB)
第一次优化 rps 只有120,继续改进,查询todo时需要通过created_at这个字段进行排序再过滤,这样以来每次查询都要先对10000条记录进行排序,效率自然变的很低,对于这个场景,可以对created_at这个字段做索引:
1
2
db.todos.ensureIndex({'created_at': -1}) db.todos.find().sort({'created_at': -1}).limit(10).explain()
现在再做一轮性能测试,有了索引之后就大大降低了排序的成本,rps 提高到了303。
1
2
3
4
5
6
7
8
9
$ wrk -t12 -c100 -d5s http://127.0.0.1:8000/todo Running 5s test @ http://127.0.0.1:8000/todo 12 threads and 100 connections Thread Stats Avg Stdev Max +/- Stdev Latency 305.94ms 42.09ms 348.38ms 94.96% Req/Sec 28.88 17.48 80.00 65.59% 1528 requests in 5.04s, 2.31MB read Requests/sec: 303.25 Transfer/sec: 469.12KB
Gunicorn 使用 Flask 内建的单进程单线程模型的 WSGI Server 远远不够,一个请求不处理完的话服务器就会阻塞住其他请求,性能很差。Flask 官方也给出了Deployment Options ,目前主流采用的有 Gunicorn 和 uWSGI。这里就选择 Gunicorn 吧!文档说明 使用2 * cpu核心数量+1个 worker,还要传入一个兼容 WSGI App 的 start up 方法,Flask 自然也实现了这个接口,只需把 Flask 实例的名字传给 Gunicorn 就 OK 啦!
1
2
3
def __call__ (self, environ, start_response ): """Shortcut for :attr:`wsgi_app`.""" return self.wsgi_app(environ, start_response)
Gunicorn 启动了9个进程(其中1个父进程)监听请求。
1
2
3
4
5
6
7
8
9
10
11
12
13
$ gunicorn --workers=9 server:app --bind 127.0.0.1:8000 [2019-12-27 16:53:22 +0800] [1552] [INFO] Starting gunicorn 20.0.4 [2019-12-27 16:53:22 +0800] [1552] [INFO] Listening at: http://127.0.0.1:8000 (1552) [2019-12-27 16:53:22 +0800] [1552] [INFO] Using worker: sync [2019-12-27 16:53:22 +0800] [1554] [INFO] Booting worker with pid: 1554 [2019-12-27 16:53:22 +0800] [1555] [INFO] Booting worker with pid: 1555 [2019-12-27 16:53:22 +0800] [1556] [INFO] Booting worker with pid: 1556 [2019-12-27 16:53:22 +0800] [1557] [INFO] Booting worker with pid: 1557 [2019-12-27 16:53:22 +0800] [1558] [INFO] Booting worker with pid: 1558 [2019-12-27 16:53:22 +0800] [1559] [INFO] Booting worker with pid: 1559 [2019-12-27 16:53:22 +0800] [1560] [INFO] Booting worker with pid: 1560 [2019-12-27 16:53:22 +0800] [1570] [INFO] Booting worker with pid: 1570 [2019-12-27 16:53:23 +0800] [1574] [INFO] Booting worker with pid: 1574
继续进行性能测试,可以看到吞吐量又有了很大的提升:
1
2
3
4
5
6
7
8
9
10
11
12
13
14
$ wrk -t12 -c100 -d5s -T1s --latency http://127.0.0.1:8000/todo Running 5s test @ http://127.0.0.1:8000/todo 12 threads and 100 connections Thread Stats Avg Stdev Max +/- Stdev Latency 118.66ms 13.48ms 168.32ms 85.07% Req/Sec 65.55 14.65 83.00 81.49% Latency Distribution 50% 116.87ms 75% 122.03ms 90% 133.10ms 99% 157.13ms 3973 requests in 5.10s, 6.02MB read Requests/sec: 778.78 Transfer/sec: 1.18MB
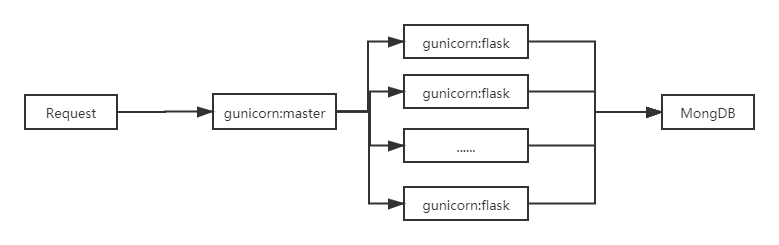
使用了多进程的模型看起来是下面这样的:
第二次优化 Gunicorn 默认使用同步阻塞的网络模型(-k sync),对于大并发的访问可能表现不够好, 它还支持其它更好的模式,比如gevent 或meinheld。它使得 worker 能够协作式地工作,当 worker 阻塞在外部调用的 IO 操作时,Gunicorn 会把执行调度给其他 worker,挂起当前的 worker,直至 IO 操作完成后,被挂起的 worker 又会重新加入到调度队列中,这样 Gunicorn 便有能力处理大量的并发请求了。
1
2
3
4
5
6
7
8
9
10
11
12
13
$ gunicorn -k gevent --workers=9 server:app --bind 127.0.0.1:8000 [2019-12-27 17:58:48 +0800] [9988] [INFO] Starting gunicorn 20.0.4 [2019-12-27 17:58:48 +0800] [9988] [INFO] Listening at: http://127.0.0.1:8000 (9988) [2019-12-27 17:58:48 +0800] [9988] [INFO] Using worker: gevent [2019-12-27 17:58:48 +0800] [9991] [INFO] Booting worker with pid: 9991 [2019-12-27 17:58:49 +0800] [9992] [INFO] Booting worker with pid: 9992 [2019-12-27 17:58:49 +0800] [9993] [INFO] Booting worker with pid: 9993 [2019-12-27 17:58:49 +0800] [9994] [INFO] Booting worker with pid: 9994 [2019-12-27 17:58:49 +0800] [9996] [INFO] Booting worker with pid: 9996 [2019-12-27 17:58:49 +0800] [9998] [INFO] Booting worker with pid: 9998 [2019-12-27 17:58:49 +0800] [10001] [INFO] Booting worker with pid: 10001 [2019-12-27 17:58:49 +0800] [10006] [INFO] Booting worker with pid: 10006 [2019-12-27 17:58:50 +0800] [10011] [INFO] Booting worker with pid: 10011
1
2
3
4
5
6
7
8
9
10
11
12
13
14
$ wrk -t12 -c100 -d5s -T1s --latency http://127.0.0.1:8000/todo Running 5s test @ http://127.0.0.1:8000/todo 12 threads and 100 connections Thread Stats Avg Stdev Max +/- Stdev Latency 94.88ms 46.28ms 557.71ms 83.51% Req/Sec 85.98 25.06 179.00 71.54% Latency Distribution 50% 85.69ms 75% 111.92ms 90% 145.55ms 99% 281.42ms 5206 requests in 5.07s, 7.92MB read Requests/sec: 1026.67 Transfer/sec: 1.56MB
rps 从 778 到了 1026,果然提升了不少。
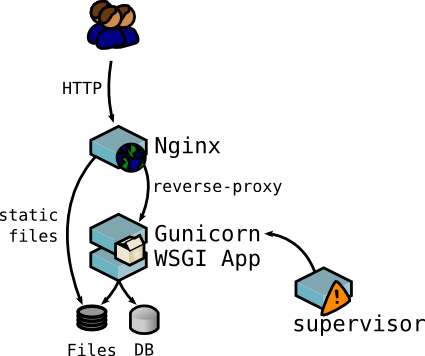
Nginx 作为 Web Server,看看 Nginx 反向代理能带给我们什么好处:负载均衡,把请求平均地分到上游的 App Server进程。静态文件处理,静态文件的访问交给 Nginx 来处理,降低了App server 的压力。Nginx 也可以缓存一些动态内容;Nginx 可以更好地配合 CDN。访问控制和路由重写。Proxy cache,SSL…
1 2 3 4 5 6 7 8 9 10 11 12 server { listen 8888 ; location / { proxy_pass http://127.0.0.1:8000; proxy_redirect off; proxy_set_header Host $host; proxy_set_header X-Real-IP $remote_addr; proxy_set_header X-Forwarded-For $proxy_add_x_forwarded_for; } }
1
2
sudo ln -s /etc/nginx/sites-available/test /etc/nginx/sites-enabled/test # 确认在 /etc/nginx/nginx.conf 里面有一句 include /etc/nginx/sites-enabled/*;
配置
/var/www/html :实际的 Web 内容,它在默认情况下只包含看到的默认 Nginx 欢迎页面。
/etc/nginx :Nginx 的配置目录,所有的 Nginx 配置文件位于这里:
/etc/nginx/nginx.conf:主要 Nginx 的配置文件,可以修改以更改 Nginx 全局配置。
/etc/nginx/sites-available:其中每个站点的“服务器模块”可以保存的目录。通常所有服务器块配置都在此目录中完成,然后通过链接到其他目录启用。
/etc/nginx/sites-enabled/:启用每个站点的“服务器模块”存储的目录。
/etc/nginx/snippets :该目录包含潜在可重复的配置段。
/var/log/nginx/access.log :Web服 务器的每个请求都被记录在此日志文件。
/var/log/nginx/error.log :任何 Nginx 的错误会被记录在此日志。
第三次优化(Redis) 结束了吗,当然没有,当我们的连接数剧增的时候看看会发生什么?
1
2
3
4
5
6
7
8
9
10
11
12
13
14
15
$ wrk -t12 -c1000 -d5s -T1s --latency http://127.0.0.1:8000/todo Running 5s test @ http://127.0.0.1:8000/todo 12 threads and 1000 connections Thread Stats Avg Stdev Max +/- Stdev Latency 442.45ms 205.38ms 996.19ms 67.60% Req/Sec 65.58 42.75 235.00 71.53% Latency Distribution 50% 416.09ms 75% 562.46ms 90% 729.98ms 99% 955.69ms 3565 requests in 5.14s, 5.42MB read Socket errors: connect 0, read 0, write 0, timeout 658 Requests/sec: 693.38 Transfer/sec: 1.05MB
不出意外出现了大量了timeout,洪水般的请求势必是对数据库的一个重大考验,阻止洪峰的方法有:限流(水桶算法)、分流(负载均衡)、访问控制、缓存等。
1
2
3
4
5
6
7
8
9
10
11
12
rds = redis.StrictRedis('127.0.0.1' , 6379 ) @app.route('/todo' def index (): start = request.args.get('start' , '' ) start = int (start) if start.isdigit() else 0 data = rds.get('todos' ) if data and start == 0 : return data todos = db.todos.find().sort([('created_at' , -1 )]).limit(10 ).skip(start) data = dumps(todos) rds.set ('todos' , data, 3600 ) return data
只有在第一次请求时接触到数据库,其余请求都会从缓存中读取,瞬间就提高了应用的 rps。
1
2
3
4
5
6
7
8
9
10
11
12
13
14
15
$ wrk -t12 -c1000 -d5s -T1s --latency http://127.0.0.1:8000/todo Running 5s test @ http://127.0.0.1:8000/todo 12 threads and 1000 connections Thread Stats Avg Stdev Max +/- Stdev Latency 490.66ms 173.25ms 999.69ms 67.18% Req/Sec 150.94 78.12 424.00 67.63% Latency Distribution 50% 472.35ms 75% 613.79ms 90% 723.53ms 99% 932.43ms 8568 requests in 5.19s, 13.03MB read Socket errors: connect 0, read 0, write 0, timeout 167 Requests/sec: 1650.09 Transfer/sec: 2.51MB
进程管理工具 Supervisor Supervisor 有两个主要的组成部分:
用途 执行一些需要以守护进程方式启动的程序,比如一个后台任务、一组 Web 服务的进程(说是一组,是因为经常用 Nginx 来做负载均衡),这些很可能是一些网站、REST API 的服务、消息推送的后台服务、日志数据的处理分析服务等。
1 2 3 4 5 6 7 [program:gunicorn ] command=gunicorn -k gevent --workers=9 server:app --bind 127.0 .0 .1 :8000 autostart=true autorestart=true stdout_logfile=access.log stderr_logfile=error.log
然后启动supervisord作为后台进程。
1 supervisord -c supervisord.conf
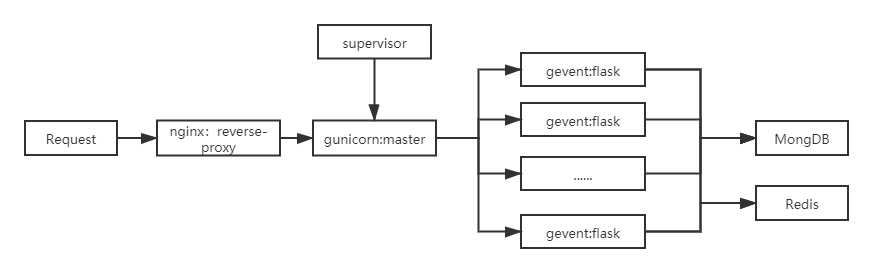
现在的应用看起来应该是这样的:
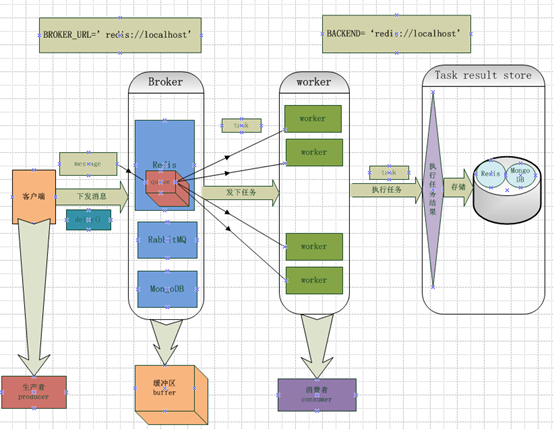
Celery 虽然缓存可以有效地帮我们减轻数据库的压力,但如果系统遇到大量并发的耗时任务时,进程也会阻塞在任务的处理上,影响了其他普通请求的正常响应,为了针对对耗时任务的处理,我们的应用还需要引入一个外部作业的处理系统,当程序接收到耗时任务的请求时,交给任务的工作进程池来处理,然后再通过异步回调或消息通知等方式来获得处理结果。分发消息和与队列打交道的调度器和一个存储消息的中间件。可以把 Celery 作为消息调度器,Redis 作为消息存储器。
Celery的架构 Celery的架构由三部分组成,消息中间件(message broker),任务执行单元(worker)和任务执行结果存储(task result store)组成: